Leslie Michel, WSDA
{soils}: An R Package for Soil Health Reporting
In {soils}, the R code used to generate custom soil health reports has been adapted for use by the general public.
March 12, 2024
Author: Jadey Ryan
Understanding soil data is crucial for making informed management decisions. However, soil health outcomes are determined by many variables, and the science surrounding soil health measurements is ever evolving. This makes it difficult to present soil data in an easy-to-understand way. Enter {soils}, a new R package developed to effectively visualize and describe soil health data.
The Washington State Department of Agriculture (WSDA) and Washington State University (WSU) developed {soils} as a step toward the State of the Soils Assessment objective: to help farmers assess their own soil health. Since 2020, more than 300 participating farmers have received customized soil health reports, intended to help them access, understand, and translate their soil data into informed management decisions.
These individualized reports support soil data democracy and empower farmers to engage with their data by:
- Providing a high-level overview of soil health in agriculture.
- Synthesizing the latest research on soil health indicators with short descriptions and graphics.
- Offering context for interpreting soil health indicators (e.g., more is better, less is better, optimal range).
- Describing how to make the most of soil testing.
- Plotting the sampled fields on a map.
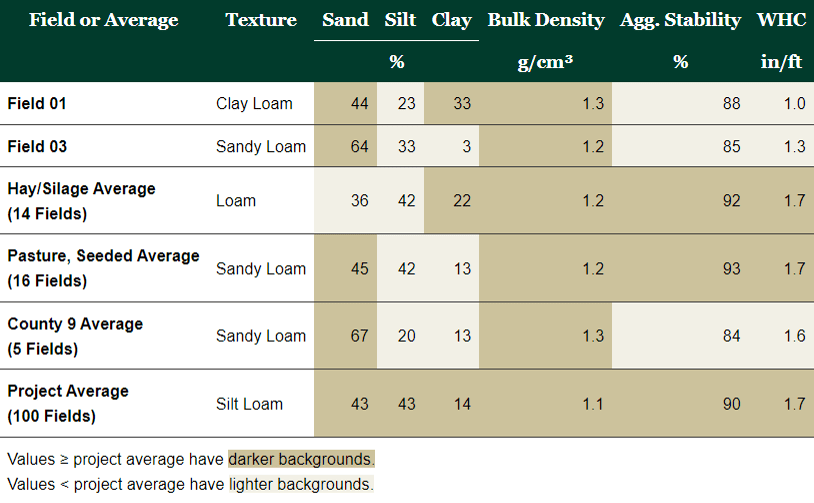
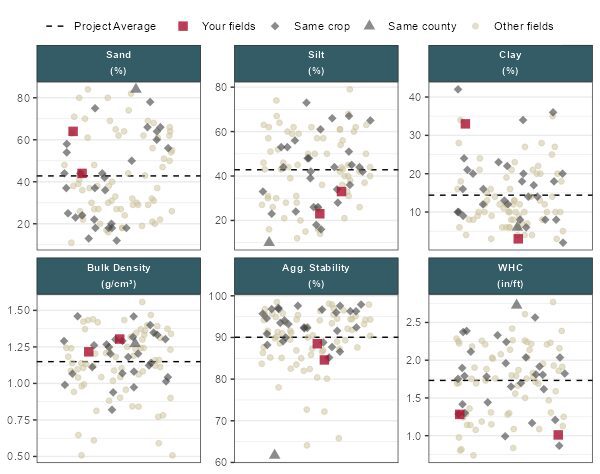
- Visualizing results in both table and plot formats.
- Comparing the farmer’s results with others in the same crop, region, and project.
- Providing the report in two formats:
- An interactive HTML file that can be opened in a computer browser.
- A static Microsoft Word document that can be printed or viewed on a computer.
Create and customize a soil health report for your soil survey
In {soils}, the R code used to generate these reports has been adapted and packaged for use by the general public. Washington data and content have been replaced with guidance and placeholder examples. {soils} enables any scientist, technical assistance provider, or extension staff comfortable with R to:
- Create a {soils} project.
- Import their data.
- Modify the report content.
- Automatically generate custom soil health reports for all soil survey participants.

These comprehensive reports help make soils data more accessible, understandable, and actionable for people without the resources and technical ability to process, analyze, and interpret it. They also offer an opportunity for technical assistance providers to conduct soil health outreach and extension with farmers in their region.
Even with these reports, soil data can sometimes raise more questions than answers. At the Washington Soil Health Initiative, we like to remind people that we are all on this journey together! The ongoing quest to understand more about soil is shared by agricultural professionals and soil scientists alike. The journey is meant to be fun, offering a new perspective on how we see the natural world.
Resources
- {soils}
- R package website includes primers on the tools used (i.e., Quarto, Markdown), tutorials, function reference guide, and example reports.
- GitHub repository includes the source code and files.
- 20-minute talk about creating the reports with R and Quarto at posit::conf(2023), a data science conference.
- Learn R
- RStudio Education provides various starting points to begin learning R.
- R for Data Science (2ed) book by Hadley Wickham, Mine Çetinkaya-Rundel, and Garrett Grolemund.
The lead author on this package, Jadey Ryan, was featured in the WaSHI Making Soils Data Actionable Webinar Series, where she described how users can customize their reports and the importance of making soils data understandable, accessible, and actionable. Check out the recording below. You can also find other resources in the video description on YouTube.

Jadey Ryan
Jadey is a data scientist in the Natural Resources and Agricultural Sciences group at the Washington State Department of Agriculture.
This article was published by the Washington Soil Health Initiative. For more information, visit wasoilhealth.org. To have these posts delivered straight to your inbox, subscribe to the WaSHI newsletter. To find a soil science technical service provider, visit the Washington State University Extension website or the Washington State Conservation District website.

