What do I do with my soil test results? Making Chemical Soils Data Actionable
Adam has been running the Thurston Conservation District’s soil testing program, helping to make soil testing accessible by interpreting results, offering context-specific fertilizer recommendations, and using automation to efficiently deliver tailored soil health reports to a diverse range of growers.
April 16, 2024
Author: Adam Peterson
I’ve been running the Thurston Conservation District (CD) soil testing program for almost four years now, but long before that, I was a user of its services. Over ten years ago, while studying agricultural science and eager to connect what I was learning about nutrient management and nutrient cycling with real-life results, I decided to test a few samples on my family’s farm to understand how past practices had influenced the soil on site.
At first, I wasn’t quite sure what it all meant, but thanks to the helpful Thurston CD employee who walked me through the results, I learned how much variability there was in soils across the farm.
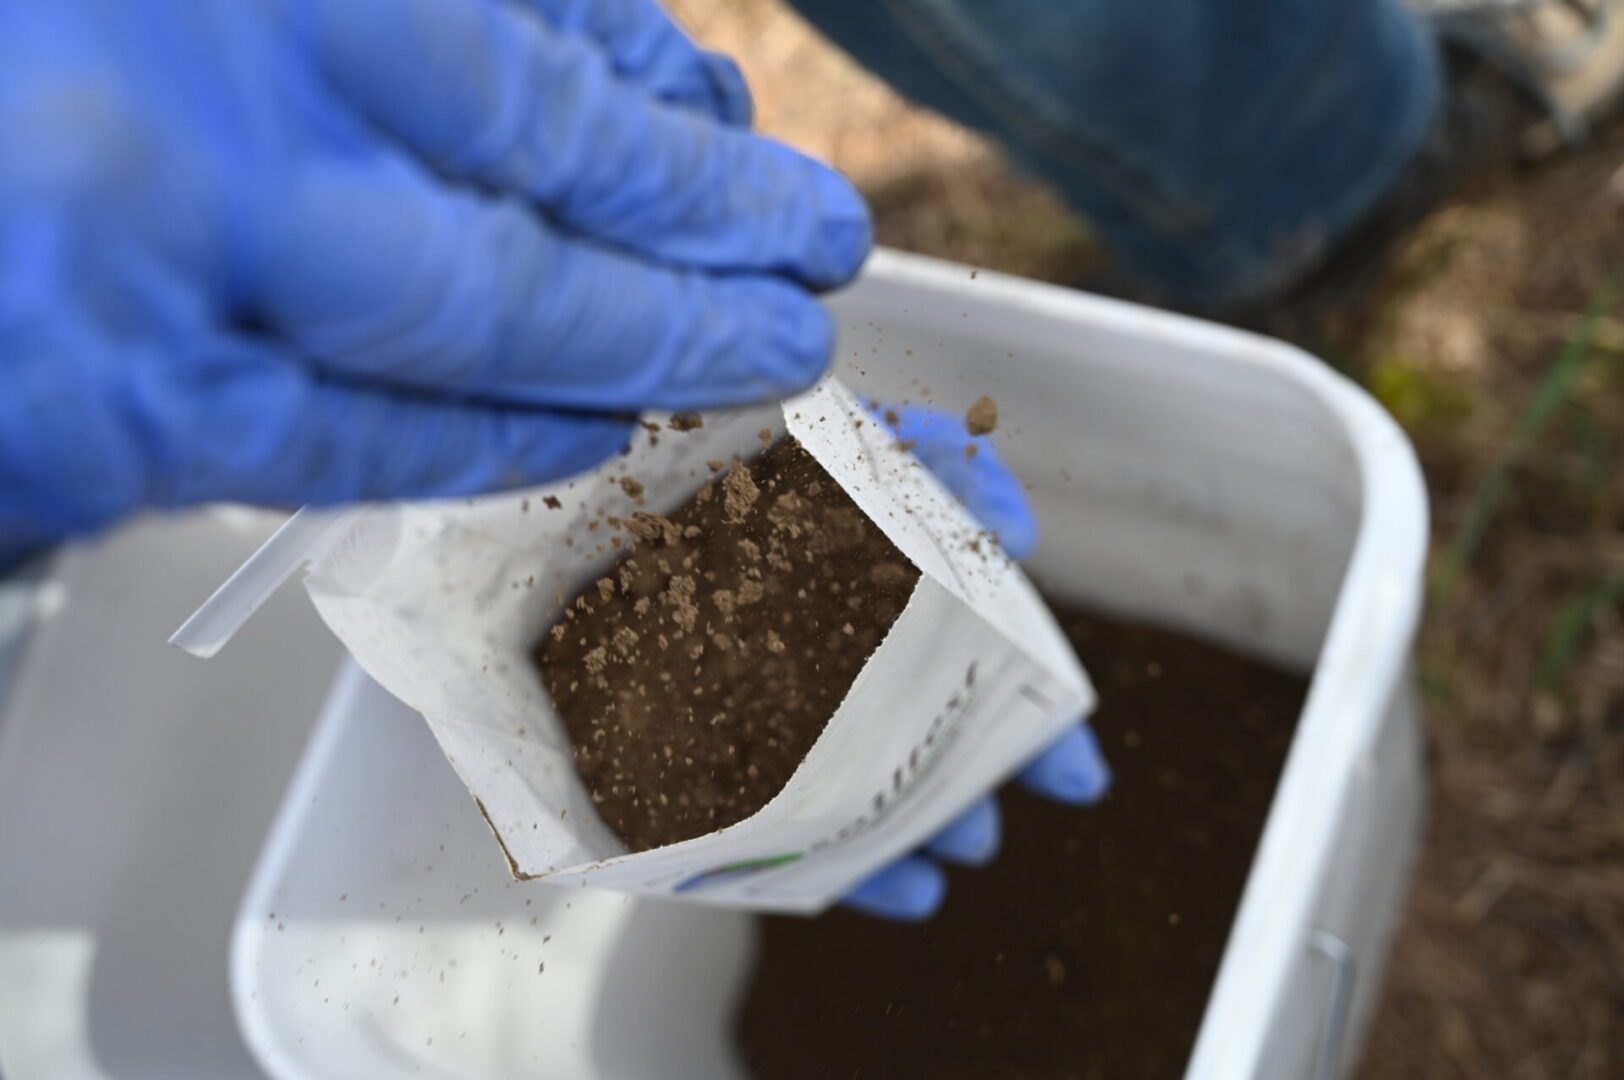
Thurston CD’s soil testing program currently receives approximately 240 soil samples a year, for 120-140 customers. Our cooperators range from large ranches and farms to backyard gardeners and small-scale diversified vegetable producers.
Just like myself years ago, many soil testers are new to soil testing and nutrient management. This may be their first time learning about soil nutrients and working with a conservation district or other technical service provider (TSP).
Making soil testing accessible
The principal aim of our soil testing program is to make the information as relevant and accessible as possible. We aim to do this in a few
First, we interpret the results. A soil test showing 71 ppm potassium versus a target range might not seem meaningful at first, but if you can describe the importance of this nutrient and that fertilizer is needed to optimize crop performance, suddenly that result means something tangible. It can act as a baseline to help mark progress. If your potassium levels are suddenly at the target range the next year, you can see what progress has been made over time.
Next, we strive to provide fertilizer recommendations that are easily implementable by our soil tester. Soil nutrient management involves a great deal of accounting, and that can be a barrier for many. Someone could look up an extension publication and see that they need 100 lbs K2O/acre based on their soil test results, but could be uncertain what this means for their 625 square foot organic garden, two-acre blueberry farm managed conventionally, or 300-acre ranch.
Many additional practical questions can arise... When do you add fertilizers to the soil? How do you add it? Is it possible to till it into the soil? What if you’re growing a perennial and you can’t till because there’s an established root system?(And why do we use K2O for potassium, which doesn’t even have a “K” in it?! Read more about that here.)
There’s a lot of work involved with going from fertilizer recommendations to appropriate and relevant actions, and one can easily feel confused and overwhelmed along the way.
By providing context-relevant interpretation and recommendations, and providing a clear roadmap towards optimal soil nutrient levels, we can help demystify the process of nutrient management. Beyond that, we can begin to teach nutrient management principles that can help spark genuine curiosity about soil science. One of the most rewarding aspects of my work is seeing community members return with nuanced questions that show engagement with the material.
Soil test reports
In our reports, we break down the main aspects of soil nutrient management. We spell out what fertilizer is needed, providing recommendations for affordable and locally available fertilizers. We explain what nutrients those fertilizers supply and the role of each fertilizer being applying. We also explain how much to add of each nutrient at a rate that matches the scale of the area being managed. Finally, we explain when to apply these nutrients and how to incorporate them into the soil.

Collecting information
To provide context-specific recommendations for soil testers, it’s first necessary to collect as much pertinent information as possible. At Thurston CD, we use an online form that adapts to ask only the questions relevant for the tester’s situation. Our form is built in Smartsheets, although there are other available options that can be used.
These forms utilize conditional form logic. This means that for each question answered in the form, the following questions are narrowed in scope to apply only to the options relevant to the tester’s needs. For example, someone who has chosen raspberries as their crop or plant type in the form will be asked if the raspberries are already planted, or whether this is a pre-establishment scenario. These two scenarios will result in two very different sets of fertilizer options. In contrast, the conditional logic structure does not ask this question for annual crops, which are planted anew each spring.
This approach allows us to build up a very large number of questions into our form for a diverse range of situations, and at the same ensure that soil testers only get asked the small subset of questions that are directly relevant to the context of their needs. Saving time and reducing frustration for users.
Scaling up capacity
The next challenge is scaling up capacity to provide interpretive reports. There is a seasonal rise in submitted reports each spring, and that means that demand peaks just at the time when producers need results the soonest.
The first tool we developed was a simple Excel spreadsheet. By entering in the pounds of each nutrient needed per acre, it quickly returned fertilizer rates at multiple scales for conventional and organic fertilizers.

More recently, I developed Python scripts that have automated much of the report writing process. By feeding in the soil tester’s answers in the Smartsheets via an API and drawing on soil testing data from our lab in spreadsheet form, the Python code is able to provide interpretive output that can be plugged into an Adobe InDesign template. Additional scripts in InDesign make additional modifications to the report, making changes like highlighting nutrients in need of fertilization and including crop-specific resource pages.

This can mean that many sets of soil test results can be turned into reports in a matter of minutes. This has proven to be an invaluable tool in helping to provide timely interpretive reports, and allows us to redirect time towards more complicated or challenging nutrient management scenarios. Automation has created a virtuous cycle of time savings that have allowed us to expand what we can provide to the public, both quantitatively and qualitatively.
Opportunities
Automation through scripting lends itself to displaying data in more accessible ways. The same Python scripts used to automate soil test reports can also be expanded to automatically generate accessible visualizations of soils data. Soils data is often numbers heavy, but it doesn’t have to be displayed as blocks of numbers. We currently include crop-specific soil pH bars, labeled and colored to show the optimal soil pH ranges for the target crop, in most of our soil test reports.

Other potential opportunities for automation are illustrating concepts like Cation Exchange Capacity, highlighting the opportunity for practices like liming to free up space for cation nutrients.

Innovation has been an important part of Thurston CD’s soil testing program from the start, and we’re aiming to expand the potential of automation towards providing services such as manure and compost testing and irrigation water management planning.
By drawing on the capabilities of automation, technical service providers can expand what they can offer to the public, in terms of capacity and quality, while saving themselves more time for personalized advice and guidance when it’s required.
Adam was featured in the WaSHI Making Soils Data Actionable Webinar Series, where he described the Thurston Conservation District soil testing program. Check out the recording below. You can also find his other resources in the video description on YouTube.

Adam Peterson
Adam a Senior GIS and Science Specialist at Thurston Conservation District, where since 2020, he has spearheaded Thurston CD's Soil Health Program.
This article was published by the Washington Soil Health Initiative. For more information, visit wasoilhealth.org. To have these posts delivered straight to your inbox, subscribe to the WaSHI newsletter. To find a soil science technical service provider, visit the Washington State University Extension website or the Washington State Conservation District website.

